The tool range provided
by Tradecision® is
unmatched by any other
similar trading software.
Intuitive Studies &
Indicators, Trading
Systems, innovative
Money Management editor,
and Exclusive Techniques
are designed to give you
confidence and a trading
edge. The power of the
system’s functionality
is enhanced by a neural
network capability,
developed by the neural
network experts.
About Technical Indicators
Tradecision enables
using the 100+ most
popular technical
indicators.
Trend indicators
are used to provide
information on price
trends. Trends measure
the persistence of a
price to move in a
certain direction during
a certain period of time.
Trend indicators are
moving averages, MACD,
DMI, Linear Regression,
and so on.
Volatility indicators,
such as Bollinger Bands,
Average True Range,
Standard Deviation,
should be used if you
want to inform a model
about price volatility.
Volatility measures the
magnitude of day-to-day
fluctuations in prices (irrespective
of the direction in
which they move).
Price momentum
indicators such as
RSI, Stochastic,
PercentR and CCI measure
the speed at which
prices move during a
certain time period.
Very often this kind of
indicators is very
useful.
There are also market
strength indicators,
such as OBV, Chaikin
Oscillator, Ease of
Movement, MFI, and
different volume
indicators.
Auto-Trends
The Auto-trends study is
used to automatically
draw trend lines
over a chart. Usually,
the break of an
auto-trend (similar to
the trendlines) shows an
entry or exit signal.
There are the following
three types of
auto-trends in
Tradecision:
· Minor duration
trend, lasting less
than a week.
· Intermediate
duration trend,
occurring within a
period of time that
exceeds one week but is
within 1-2 months.
· Major duration
trend, lasting
longer than one or two
months.
The study also
identifies sideway
trends, i.e. those
periods, during which
the direction of the
trend is unclear.
Sideway trends are
marked with horizontal
lines.
This study identifies
and marks a turning
point in the trend
on a chart. Tradecision
identifies Minor,
Intermediate or Major
turning points. Pivots
are useful as the start
or end points when
drawing objects (such as
Fibonacci retracements)
or other analytical
studies are used.
Wide-Ranging days
To count Wide-Ranging
Days, Tradecision uses
Jack Swagger`s approach.
The study is calculated
in the following way:
True Range of the
current bar is divided
into the number of the
Average True Range of X
(Wide-ranging day length)
bars, and if the result
is equal to or greater
than the Wide-ranging
day ratio, the bar is
marked as a wide-ranging
day.
With Tradecision, you
can use Gann Fan,
Gann Cardinal Squares,
and Gann Grid.
Gann
Tools
William D. Gann
(1878-1955) is a trading
legend. He created and
developed several
powerful techniques for
studying market action.
These include Gann
Angles, Gann Fans, Gann
Grids and Cardinal
Squares.
Fibonacci Studies
Tradecision enables
drawing Fibonacci
Retracements,
Fibonacci Extension,
Fibonacci Circles,
Fibonacci Fans,
Fibonacci Times Zones,
and Fibonacci Time
Retracements.
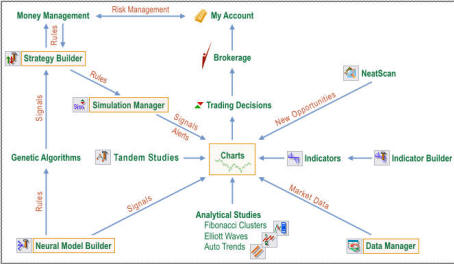
State-of-the-Art Trading
System Tools
Strategy Builder
Simulations Manager
Money Management
Strategy Optimization
Alert Builder
A trading strategy
is an objective set
of rules on when and how
to enter and exit
positions. This set of
rules should not vary
subjectively from day to
day based on brokers`
recommendations, friends`
tips or emotions, and,
therefore, can be
tested using past data
to understand
objectively how
profitable, reliable and
suitable to your trading
style these rules are.
First of all, you need
to formalize your own
trading ideas or modify/improve
well-known ones. To do
so, you need to define
the conditions for your
buy/sell orders.
To define the entry/exit
conditions, you can use
the Improvian
language, offering
more than 140
built-in functions,
as well as Improvian
Editor, designed to
facilitate your rule
creation process. If you
are new to strategy
development, you can
start with any of the
10 predefined strategies
supplied with
Tradecision. All of
them are based on
well-known trading ideas
and can (or even should)
be improved to suit your
needs.
Special
Techniques
Ingenious MA
Custom Bars
Fibonacci Clusters
Jurik Indicators
Noise Removal
Hurst Exponent
Multi-Data Strategies
Neural
Nets
The Tradecision
Model
Builder helps you
create successful neural
models and use them in
your strategies, thus
building better
trading systems
than those created using
standard technical
analysis.
The Tradecision GUI is
very user-friendly. In
fact,
no mathematical
or artificial
intelligence background
is required for
wizard-based creation of
neural models.
Model Builder Features
- Model Builder
enables analyzing
over 100 model
performance figures
derived by using
a model-based
strategy;
- You can
verify the
statistical measures
of the quality of
your model
forecasting with the
help of the Model
Performance Report;
- Using the Input
Importance Chart,
you can determine
the relative
importance of each
model input;
- Actual vs.
Forecasted Graph
displays a line
graph of the actual
and forecasted
target values for
all bars from the
training or test
periods;
- Visual
analysis of
model-based signals
can be enabled with
just one click
by inserting them
into the main chart;
- All models are
automatically saved
into the internal
database. You can
edit, re-train or
delete a model
stored in the
database at any time.
Model-Based Strategies
To test a model,
Tradecision applies a
simple model-based
strategy to historical
data and
determines
whether you would have
made a profit if you
had followed this
strategy, or not. If the
strategy turns out to
have been profitable,
and if it fits your
trading personality, you
can be confident in
using the model to make
future trading decisions.
A major advantage of
model testing using a
model-based trading
strategy is the
possibility to
rigorously test the
model over different
periods of time and with
different parameters.
To help you thoroughly
analyze a model-based
strategy, Tradecision
creates the
Strategy
Performance Report.
The report provides
detailed information
about your strategy,
including the return on
account, drawdowns, risk
ratios, number of
profitable/losing/outlier
trades, as well as
timing analysis. To
ensure that the figures
of the Strategy
Performance Report are
as close to reality as
possible, you can factor
in broker`s
commissions and
slippage.